Categories
Final Submission

Expanding Director Engine compatibility in ScummVM

For the last 12 weeks I’ve been working on the Director Engine to increase support for it in ScummVM. Originally created by Macromedia, the Director Engine is under development for the last 9 years in ScummVM now. My goal was to inch ever closer to fully supporting games made using Director 4 and Director 5.


Goals for the Project:

I had outlined the following three major goals in my original proposal:
1. Completing support for all the workshop movies and implement all the stubbed functions.
2. Writing Director Files in ScummVM by implementing saveMovie lingo command.
3: Add support for titles SafeCracker and The Journeyman Project in the Director Engine.

Goal number 2 was the primary goal of the project, which I worked on first.

Goal number 3 was changed partially. Instead of working on the titles SafeCracker or Journeyman Project, I tried to work on Trektech.

Goal number 1 was changed. Instead of working on Stubbed functions and workshop movies, I worked on the ImGui visual debugger in the Director engine.

The goals for this project were regularly discussed with my mentor @sev.


What I did:

Before and during the initial few days of the coding period, I worked on the QTVR Xtra for the Director Engine. I implemented rendering in higher quality and warp (mode 0) for panoramas. I also implemented the swing transition while panning panoramas.

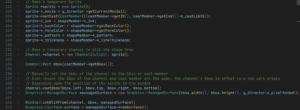
To add support for games like tkkg-1, I implemented the lingo command saveMovie which saves the current movie in its current state, effectively working as a save file.

I tried implementing support for movies as cast members which was an essential feature required for the title Trektech. However, I only went as far as loading them and processing lingo scripting for simple movies. I couldn’t get it to work for Trektech. Since, it proved too much for my level of experience, as per my mentor @sev’s advice, I left the work incomplete and pivoted to the next task.

I fixed the following bugs in Director.
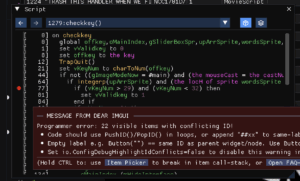
1. Fix Duplication of cast members in case of multiple casts.
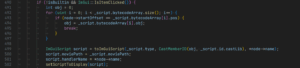
2. Avoid usage of  unreliable value LingoDec::Scripts::CastId.
3. Disabling event processing while b_alert is called.
4. Fix deprecation warnings in Director engine compilation.

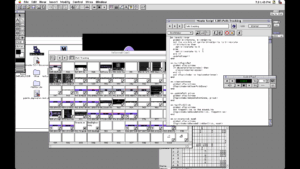
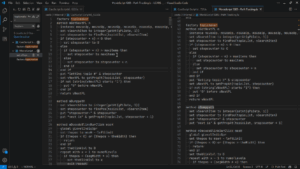
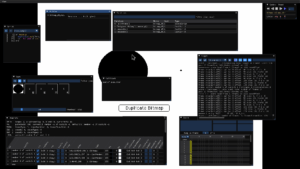
I also made some upgrades to the ImGui visual debugger in the Director engine. Majorly including:
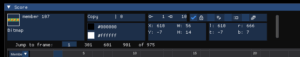
1. Rendering previews for some of the cast members.
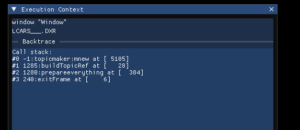
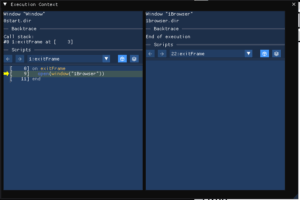
2. Improving/refactoring the Script/Callstack window into the Execution Context window.
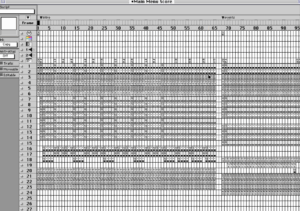
3. Improving the Score window to show continuation data.
4. Implement Loading/Saving ImGui state.
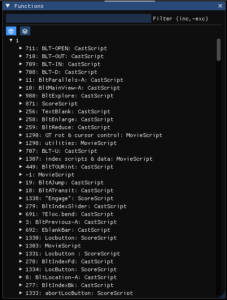
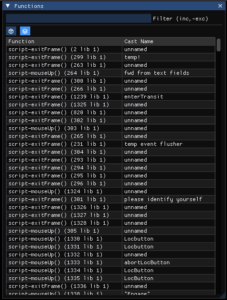
5. Reworking Functions window to use reliable references.
and a number of other small things.


The Current Status:

The saveMovie lingo command was successfully implemented. This was also tested and verified using the title tkkg-1.

Support for Trektech and movie cast members is incomplete. Simple test movies with basic lingo scripting work well. However, it is unreliable as seen by the crash in Trektech, as soon as it tries to load a movie cast member. I will continue working on this.

The ImGui debugger has seen a fair number of upgrades. However, it does need more work to be called complete. I still have a draft PR continuing the work.


Implemented code:

Here is a link to all the pull request that were merged during the period (18 in total).

Here is the link to the draft PR for ImGui improvements.


Challenges faced/Lessons Learned:

Director engine, as mentioned, is under development since the last 9 years. A lot of the development is already complete. Hence, it was difficult for me to grasp its large code base, given my limited experience with large projects. On top of that, My insistence on figuring out solutions independently proved harmful, sometimes resulting in slow progress.

The Director engine is a fun engine to work with. I learned a lot of concepts related to Software Development and Object Oriented Programming. I also learned how to use version control systems properly.  I also learned how to communicate programming ideas when there are multiple people working on the project.


I enjoyed working on ScummVM. So much so that I’ll continue contributing occasionally. I am thankful for the organizers of GSoC and my mentors @sev, @rvanlaar, @OMGPizzaGuy and @somaen, for guiding me through. I hope my contribution benefits developers as well as users of ScummVM.

Categories
Week 12

Another upgrade to the ImGui Debugger

For the last week of GSoC, I was working on some more improvements to the ImGui Debugger in the Director engine. Making the ImGui debugger as close to the original Director engine as possible will be very helpful in adding support for games in the future.

The first thing to do was to revamp the Functions window. It used to show all the handlers from all the scripts in the window in a single table. Since, that was not only messy and not properly navigable, @sev asked me to revamp it so that there are two views:


One: that shows all the handlers just like how it was shown previously and two: one that shows each script, and each script (‘Lscr’ context) and under each script we have all the handlers in that script. This allows us to navigate between scripts very easily. This also means, in the second view, the filtering works better, i.e. we can filter out all the handlers with a certain name (e.g. mouseUp) or those associated with a particular cast member (say no. 123) easily.

After that, we noticed that some of the scripts didn’t show the cast member number in the Execution Context window properly (e.g. -1 for the topicmaker:mnew in the screenshot):

Now, the cast id (even though present in the ‘Lscr’ data stream, is not reliable) is fetched from the associated cast member. Since cast IDs and script IDs are linked together, we can map the script ID to its corresponding cast ID. But, it was possible that some of the cast members are not loaded, because of lack of support or some error (e.g. Picture cast member). Hence, at first I thought, forcing the loading of their cast member info might solve this problem. However, I was wrong. But I thought it might still be a good and harmless addition, hence I made a PR.

It turns out that some of the ‘Lscr’ contexts are factory scripts, i.e. they have a parent script (which is associated with a cast member) and the handlers in the current script context are called in reference to the parent’s cast member. As you can see from the following screenshot of LCARS___.dir loaded into the origin Director engine, the handler `topicmaker:mnew` is part of a movie script (cast ID: 1285):

Even while dumping the scripts, ProjectorRays/ScummVM dumps the handlers in the current script as part of the parent script and completely ignores the current script (the one without a cast member associated):

This is the list of all the parent scripts and their child script:

“`
Who is: 236, whose parent: 89
Who is: 239, whose parent: 93
Who is: 232, whose parent: 234
Who is: 188, whose parent: 599
Who is: 597, whose parent: 623
Who is: 216, whose parent: 624
Who is: 21, whose parent: 646
Who is: 230, whose parent: 657
Who is: 26, whose parent: 721
Who is: 131, whose parent: 722
Who is: 24, whose parent: 723
Who is: 179, whose parent: 725
Who is: 131, whose parent: 727
Who is: 163, whose parent: 728
Who is: 199, whose parent: 729
Who is: 131, whose parent: 730
“`
Hence, the solution was to not show the associated castID but rather the script ID, which is unique to each script. Hence, it required storing the parent number and the script number in the ScriptContext class, and show that in the Execution Context window. This solved the problem. @sev then asked me to change all the references to a handler in a similar way, including the way we name the dumped scripts. This honestly took way too much time to figure out.

Also, the scripts are now shown in a separate window when we click on a handler in the Functions window rather than showing them in the Execution Context window. Hence, we can see as many scripts as we want at the same time.

Also, the handlers in the call stack are now selectable. You can click on them to jump to the exact byte code in the script shown below in the Execution Context window. To make the scrolling work, I had to include a separate boolean in the ImGuiState struct.

After that, there were a bunch of minor issues, like the scrolling in the Execution Context window when we jump to the definition, sanity checks for fetching `ScriptContext` through the handler Director::DT::getScriptContext, marking the script dirty when a button in the control panel is placed, and some other stuff too minor to notice here.

Also, in the Score, the original director shows whether or not a sprite changes in subsequent frames. Like follows:

I was working on adding a similar functionality in the Score window, but I’m only halfway there.

I’ll be adding the rest of the functionality in the next two days.

Hence, overall a slightly less than average week. I was busy over the weekend for the academic project for final year (my faculty advisor is not happy with our progress). Initially I planned on making this post my final submission, but later decided against it. I’ll be making a separate post underlining all the progress that I made over the last  12 weeks as my final submission.

Categories
Week 11

ImGui: Refine the debugger to a usable state

This week again, I continued working on the ImGui visual debugger in Director, mostly working on small bugs and broken features caused by the work in the previous weeks.

The Execution Context window shows the lingo scripts being executed. To make it show multiple handlers from the same script at once, I had made changes that broke the navigation. Stepping in, stepping over and stepping out in the control panel didn’t work properly, jumping multiple instructions at once. The problem was that startOffsets of the script weren’t getting stored, since I needed to render multiple handlers, each with a separate ImGuiScript object. These startOffsets store the offsets of each line of script. While stepping in/over/out, the lingo program counter is compared with these to find out which line is getting executed at the moment.  I had to make sure that the ImGuiScript object associated with handler currently being executed persisted and was passed by reference to the renderScript() function so that it will store the startOffsets properly. Also I had to make sure that the _script->_dbg._isScriptDirty flag is set after all the scripts are rendered. Previously it was set to false after rendering the first script.

In the lingo scripts in the Execution Context window, if there is a call to a function, you can press the function to go to its definition. However, the search for the handler was flawed. The value we were passing to the function that fetches the ImGuiScript as the castId of target script, was wrong. It took me some time (and some messing around with ProjectorRays) to figure out that this is the Id (or index) of the script (in cast of a localcall, this is the index of the script in the script context (consisting of scripts in the same file/’Lscr’ resource), whereas in an extcall it was the index of the script in the global context (consisting of all scripts)).

This is obviously wrong, hence I had to find out the actual castId of the script which contains the handler, since castId and scriptId are coupled, I can find the castId using the scriptId and pass that, which worked as expected.

During this, I also realized that for some reason, some of the scripts weren’t showing up in the debugger at all, apparently for no reason at all. Upon some investigation, I found out that the way the scripts were fetched was, that the LingoDec decoder reads these scripts and the corresponding data. One of which was the castId of the script, which it turns out isn’t reliable. It may be wrong, it may have duplicates, can’t be trusted. Hence, instead, from the HashMap that maps the castID of a cast member to its script id, I fetch the castID and use that to fetch the script, which worked like a charm. This PR should explain the issue in detail. This also solved an issue where, when asked to dump the scripts, the names of the files dumped and the scripts didn’t match at all.

I had to also solve scrolling issue in the Scripts window. After jumping to a handler, if the script contained only one handler, the scrolling worked fine, but in case of multiple handlers, it used to jump to the last handler. Had to introduce a _scrollTo flag which was set only when rendering the current script.

I also got rendering of text and shape previews this week. In order to render them, I was at first checking which channel had the text/shape to be rendered, and pass that channel and a ManagedSurface to Window::inkBlitFrom(), and showing the surface in the preview. However, obviously, this meant that if a shape/text is not on the stage at the moment, it won’t show a preview. Hence, I had to prepare a dummy channel with the correct sprite and relevant properties (e.g. thickness, foreground color, background color, pattern, etc.) and then blit it to a temporary surface for preview. This honestly took some time to figure out.

Other than this, there were some minuscule things, too unnecessary to mention here.

Hence, overall a pretty normal week again. Next week is the final week for coding after which there is the final submission. I hope to have done enough to count the project as a success.

This week also brought good news in the form of a job offer. In most engineering colleges in India, recruiters visit the college to hire final year students as graduate trainees. I was lucky enough to be selected at one such offer. Now that I have this security, I can continue to contribute to ScummVM even after GSoC. Not as regularly but over weekends and holidays. Working on ImGui has been fun but I wanted to directly work on making a game work in ScummVM’s Director, similar to how @rvanlaar was working in SafeCracker. Couldn’t unfortunately succeed at that during GSoC but I’m planning on doing so afterwards. Looking forward to that!

Categories
Week 10

ImGui: Improving the Visual Debugger

This week, I continued my work on Director ImGui debugger from last week. Working on ImGui has been bit of a fun exercise since, it is an open canvas. There are a lot of opportunities to improve upon, and it all depends on what a developer might find useful while working on Director engine.

First of all, there were a bunch of impurities with the ImGui debugger. e.g.

  • Many child widgets have the same problem as the breakpoint window error pop-up from last week. i.e. widgets having the same label and id causing the ImGui throw an pop-up error saying changes made to one widget will be reflected to the other. I solved the same problem in the following places:
  • i.   Vars Window
    ii. Watched Variables
    iii. Scripts handler widget
  • I also improved the search for handler in the getHandler function. Instead of searching for the handler in all casts, we can single out the cast that has the handler in it.
  • When displaying Prop list in the execution handler window, there was a missing line, which I promptly added.

And a bunch of other small stuff, too small to be worth noting here.

Another feature that was stubbed in the debugger was being able to load and save the current state of the debugger into a persistent file. So, we can save a position in the game we are currently working on, and load the same position every time we start  a debugging session.
We went with the JSON format to store the state. We are currently storing the following things (and loading them back):
1) Window Positions
2) Score frame number
3) Windows that are open/closed
4) Global, Local and Watched Variables
5) Breakpoints
6) Log
7) Colors
Here, @OMGThePizzaGuy and @lephilousophe showed me `ImGui::SaveIniSettingsToMemory/ImGui::LoadIniSettingsFromMemory` which made my job much easier.

In the Watched Vars window, I am also showing Local Variables and Global Variables with different colors. On top of that, Local Variables that are out of scope are shown with different color.

All variables are now shown with `renderVariable()` which allows variables to be clicked on to add them to the WatchedVars list and also show their current value.

Previously, the Scripts window only showed the handler being executed at that moment. However, for better navigation, @sev suggested that all the scripts from the same lingo context should be shown in the same window. This took me a while. Since, now not only was I rendering multiple (ImGui) widgets for multiple (Director) windows, I was also showing rendering multiple handler in the same Scripts widget. This caused a bunch of problems with stepping over e.g. pressing step over caused the script to move multiple steps forward, and with showing the current line in the handler (with a little yellow arrow), because the _state->_dbg._isScriptDirty was getting set to false immediately after the first script was rendered. Also, the scroll to the current line was also not working. This took some time and debugging to fix.

When @sev started review on my PR, he immediately pointed out that I was making a separate ImGuiState::state for each window, which in hindsight I realized was a mistake. So, I reworked it to only make a separate instances of the objects that are needed to hold the execution context of a window. This also took a while to get right. There was a bunch of unexpected behavior including, the scripts were not showing up the first time the ‘step’ button was pressed in the control panel.

I also fixed a deprecation warning that occurred while compiling the Director engine. I had to create a custom copy constructor for the MacWindow class since the synthesized copy constructor was calling a deprecated copy constructor for the ManagedSurface class. Instead I had to use a copyFrom method as suggested.
There was another instance of use of deprecated method operator= for the ManagedSurface class, used copyFrom there as well.

Overall, a somewhat normal week. I hope to make even more improvements to the ImGui debugger. e.g. Adding a trace for watched variables is next on the list.

Categories
Week 9

Working on ImGui is fun!

This week I worked on some improvements on the ImGui visual debugger in the Director engine created by @sev. It allows us to see the lingo scripts being processed, cast members and their properties, score and a bunch of other stuff.

There was an extremely minor problem with the scripts window. The script window allows us to put breakpoints into the movie. However, the check boxes for the breakpoints were all being rendered with the same ID. ImGui has an label+ID system to name UI elements. Each new UI element must have a unique label+ID combination. Which was a simple mistake, rectified immediately.

The second thing was in case there are multiple windows, i.e. there are (Director) windows present other than the stage, then the ImGui just clubs all of the scripts being processed into a single (ImGui) Scripts window. So, we need to have a separate pane for the script being processed in each (Director) window.

For this, my idea was to create a separate `ImGui::_state` for each (Director) window and store them in a hashmap. Each time `showExecutionContext()` is called, we take the `ImGui::_state` for each window, and render them.
_state = getWindowState(stage);
updateCurrentScript();

Although, I ran into a multiple problems:
1. The execution context (ImGui) window once turned on, should stay turned on, but it was disappearing as soon as the (Director) window changes.
2. The control panel was debugging the script for the wrong (Director) window.
3. The other (ImGui) windows were being turned off whenever the (Director) window changes.
4. The multiple windows were showing the same script because the LingoState wasn’t changed in the global lingo context g_lingo.
5. The other panes were not showing any scripts because the `getHandler()` function wasn’t able to find the lingo script with the correct cast ID.
Solved these one by one and created a pull request yesterday.

Also, the callstack is currently a separate (ImGui) window. We also need to combine that with the scripts into a new (ImGui) window named the Execution Context. I did the refactoring. The Execution Context now looks like follows:

There was also a minor font rendering issue in the Score (ImGui) window. Apparently there were multiple breaking changes in the 1.92.0 update for ImGui regarding Font changes. However, it didn’t take long to figure out that it was just a one line change. I just had to set the `ImGui::IO::DefaultFont`, which is NULL by default. Previously when called:
ImGui::PushFont(ImGui::GetIO().DefaultFont)
The PushFont function would see that DefaultFont is NULL, and automatically push the first font added to using ImGui::AddTTF****. However, after the update, if the parameter to ImGui::PushFont is NULL, the font is unaffected and only the font size is changed. Hence, I had to manually make sure that ImGui::IO::DefaultFont is not NULL.

Overall, I didn’t feel stuck at any point. The process of figuring this out was smooth. However, this still took me a week to finish because I took an off day in the middle of the week. Also, due to my house hunt (which was a pain and a half) I used to start late @10PM IST and get tired by 2AM IST and doze off! Although I had written about it in my proposal, that I’ll have less time once my college starts, this is less than I had anticipated. This makes me worry about my GSoC project’s success. This week will be better, now that I (hopefully) have a stable abode. I’ll start consistently @6PM IST and put in 6-7 hours before calling it a day.

Here’s to hoping for a better week (again)!